Introduction ELK Stack - to Get Logs

img source : https://unsplash.com/

Requirements for this tutorial:

  • node3 -> ubuntu 18.4 -> server
  • node4 -> ubuntu 18.04 -> client
  • node5 -> centos 7 -> client

Let’s Go:

Excecution on node3

1. Update

# apt -y update

2. Install OpenJDK

# sudo apt -y install openjdk-8-jdk
# java -version

3. Install Elasticsearch

# wget -qO - https://artifacts.elastic.co/GPG-KEY-elasticsearch | apt-key add -
# apt -y install apt-transport-https
# echo "deb https://artifacts.elastic.co/packages/7.x/apt stable main" | tee -a /etc/apt/sources.list.d/elastic-7.x.list
# apt -y update && apt -y install elasticsearch

4. Configuration Elasticsearch

# cp /etc/elasticsearch/elasticsearch.yml /etc/elasticsearch/elasticsearch.yml.original
# vi /etc/elasticsearch/elasticsearch.yml

edit line 55 to uncomment

network.host: localhost

5. Activate elasticsearch service

systemctl daemon-reload
systemctl enable elasticsearch
systemctl start elasticsearch
systemctl status elasticsearch

6. Test Elasticsearch

root@node3:~# netstat -tulpn                                                       
Active Internet connections (only servers)
Proto Recv-Q Send-Q Local Address Foreign Address State PID
/Program name
tcp 0 0 0.0.0.0:80 0.0.0.0:* LISTEN 206
58/nginx: master
tcp 0 0 127.0.0.53:53 0.0.0.0:* LISTEN 843
3/systemd-resolv
tcp 0 0 0.0.0.0:22 0.0.0.0:* LISTEN 202

Curl elasticsearch

root@node3:~# curl -XGET 'localhost:9200/?pretty'
{
"name" : "node3",
"cluster_name" : "elasticsearch",
"cluster_uuid" : "PPNElJoQT7mo8LP9hOkdBA",
"version" : {
"number" : "7.5.2",
"build_flavor" : "default",
"build_type" : "deb",
"build_hash" : "8bec50e1e0ad29dad5653712cf3bb580cd1afcdf",
"build_date" : "2020-01-15T12:11:52.313576Z",
"build_snapshot" : false,
"lucene_version" : "8.3.0",
"minimum_wire_compatibility_version" : "6.8.0",
"minimum_index_compatibility_version" : "6.0.0-beta1"
},
"tagline" : "You Know, for Search"
}

Kibana

1. Install Kibana

apt -y install kibana

2. Configuratation & integration kibana with elasticsearch

cp /etc/kibana/kibana.yml /etc/kibana/kibana.yml.original
vi /etc/kibana/kibana.yml

edit line 7 to uncomment

server.host: "localhost"

3. Activate kibana service

systemctl enable kibana
systemctl start kibana
systemctl status kibana

4. Install & configuration nginx as a reverse proxy

  • install nginx
    apt -y install nginx apache2-utils
  • configuration nginx

      # cp /etc/nginx/sites-available/default /etc/nginx/sites-available/default.original
      # vi /etc/nginx/sites-available/default

edit file /etc/nginx/sites-available/default, to be

server {
listen 80;

server_name _;

auth_basic "Restricted Access";
auth_basic_user_file /etc/nginx/htpasswd.kibana;

location / {
proxy_pass http://localhost:5601;
proxy_http_version 1.1;
proxy_set_header Upgrade $http_upgrade;
proxy_set_header Connection 'upgrade';
proxy_set_header Host $host;
proxy_cache_bypass $http_upgrade;
}
} 
  • Create user & password to login dashboard kibana
    # htpasswd -c /etc/nginx/htpasswd.kibana [username]
  • Activation nginx service
    systemctl enable nginx
    systemctl restart nginx
    systemctl status nginx
    netstat -tupln

5. Access kibana dashboard
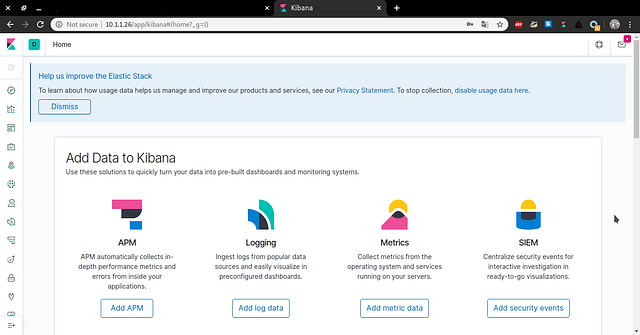
http://IP_node3

LOGSTASH

Excecution on node3

1.  Install Logstash

apt -y install logstash

2. Configuration Logstash

vi /etc/logstash/conf.d/input-filebeat.conf
Create input to elasticsearch
input {
beats {
port => 5044
}
}
Create output to elasticsearch
vi /etc/logstash/conf.d/output-elasticsearch.confoutput {
elasticsearch {
hosts => ["localhost:9200"]
manage_template => false
index => "%{[fields][log_name]}_%{[agent][hostname]}_%{+YYYY.MM}"
}
}

3. Activate logstash service

systemctl enable logstash
systemctl start logstash
systemctl status logstash
netstat -tupln

FILEBEAT

Excecution on node4 & node5

1. Install Filebeat on node4
# apt -y update

# wget -qO - https://artifacts.elastic.co/GPG-KEY-elasticsearch | apt-key add -
# apt -y install apt-transport-https
# echo "deb https://artifacts.elastic.co/packages/7.x/apt stable main" | tee -a /etc/apt/sources.list.d/elastic-7.x.list
# apt -y update && apt -y install filebeat

# systemctl enable filebeat
# systemctl status filebeat

2. Install Filebeat on node5

# yum -y update
# rpm --import https://packages.elastic.co/GPG-KEY-elasticsearch
# vi /etc/yum.repos.d/elastic.repo

...
[elastic-7.x]
name=Elastic repository for 7.x packages
baseurl=https://artifacts.elastic.co/packages/7.x/yum
gpgcheck=1
gpgkey=https://artifacts.elastic.co/GPG-KEY-elasticsearch
enabled=1
autorefresh=1
type=rpm-md
...

# yum -y install filebeat

# systemctl enable filebeat
# systemctl start filebeat
# systemctl status filebeat

Send log to logstash

Excecution on node3

Configuration Logstash

vi /etc/logstash/conf.d/filter-syslog.conf

...
filter {
if [fields][log_name] == "syslog" {
mutate {
add_tag => [ "syslog" ]
}
}
}
Restart logstash service
systemctl restart logstash
systemctl status logstash

Execution on node4 & node5

# mv /etc/filebeat/filebeat.yml /etc/filebeat/filebeat.yml.original

Config filebeat on node4

# vi /etc/filebeat/filebeat.yml
...
filebeat.inputs:
- type: log
enabled: true
paths:
- /var/log/syslog
fields:
log_name: syslog

output.logstash:
hosts: ["IP_internal_node3:5044"]
...

Config filebeat on node5

# vi /etc/filebeat/filebeat.yml
...
filebeat.inputs:
- type: log
enabled: true
paths:
- /var/log/messages
fields:
log_name: syslog

output.logstash:
hosts: ["IP_internal_VM_node3:5044"]
...
Activate filebeat service
# systemctl restart filebeat
# systemctl status filebeat
Excecution on node3
root@node3:~# curl http://localhost:9200/_cat/indices?v
health status index uuid pri rep docs.co
unt docs.deleted store.size pri.store.size
green open .kibana_task_manager_1 M7mX7JkxRhqbRSFaZCZZ6w 1 0
2 1 43.5kb 43.5kb
green open .apm-agent-configuration _zg4Oj8OT-mPis3Xmaf5lw 1 0
0 0 283b 283b
yellow open syslog_node4_2020.01 zBnZ3VmORRyAVS37ozsC9A 1 1
187 0 194.1kb 194.1kb
green open .kibana_1 QOG6VQDFTzK0HXjeJQKRZQ 1 0
7 0 40.4kb 40.4kb
yellow open syslog_node5.novalocal_2020.01 QXjp-0GVTDSrOFKuFOY8Ig 1 1
856 0 376.1kb 376.1kb

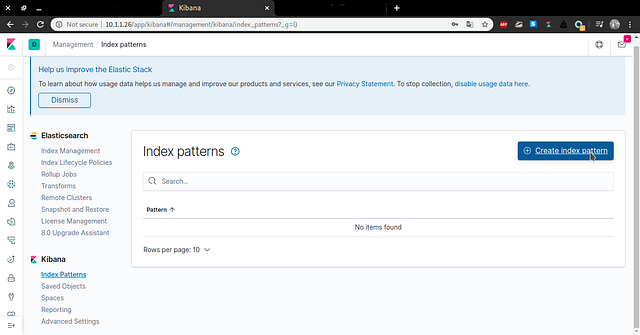
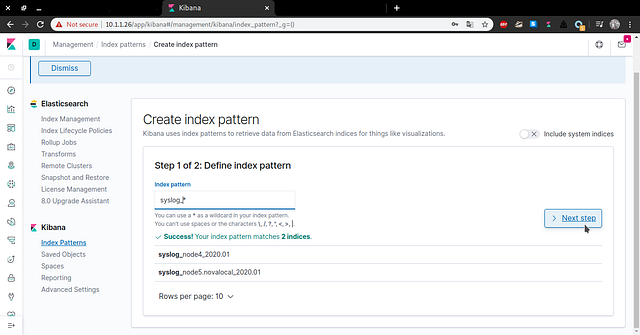
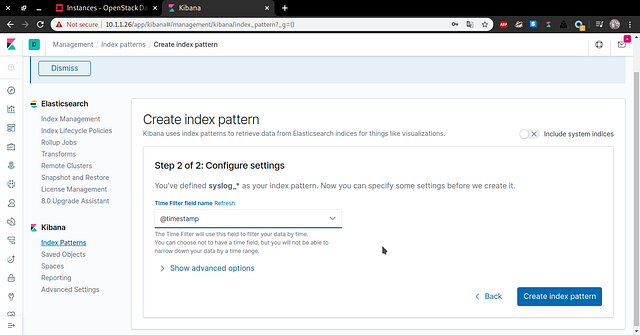
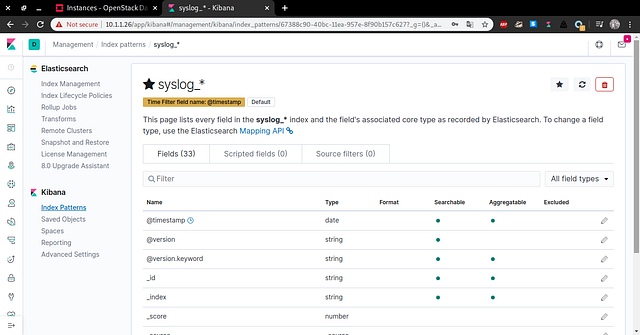
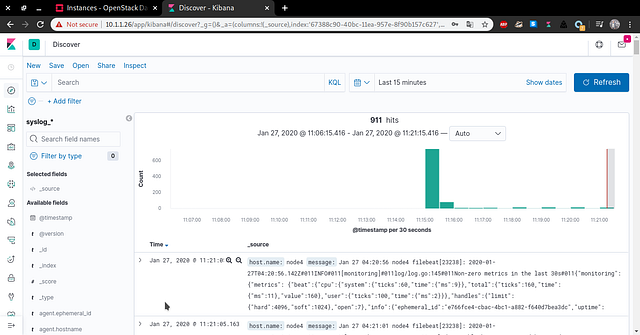
Dashboard Kibana
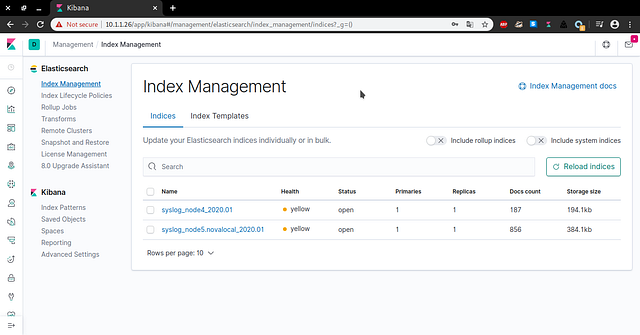


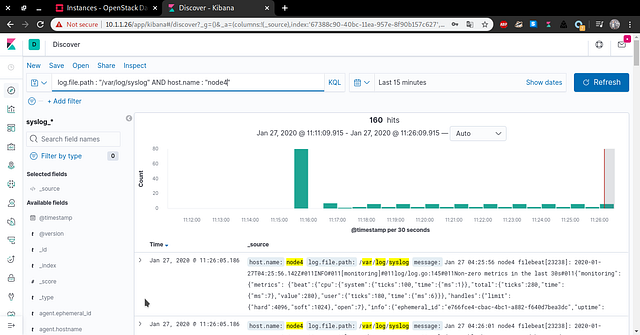
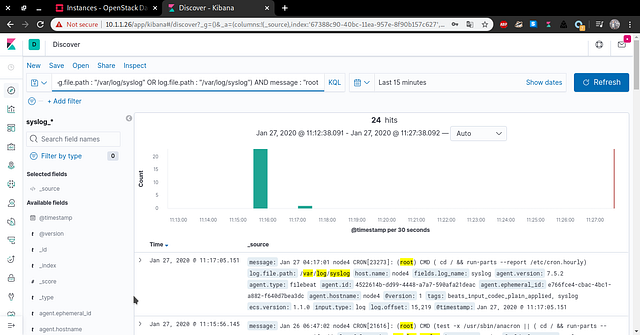
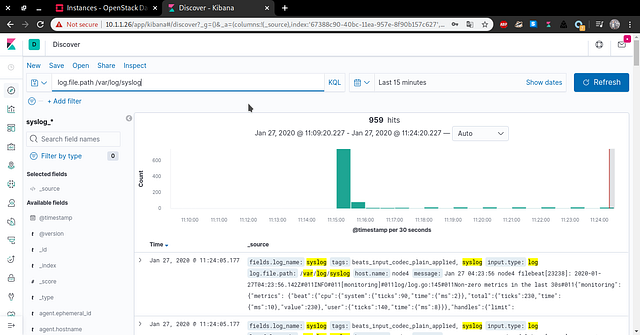
Search Log
Thanks.

Share:

Monitoring Prometheus dengan Grafana

Depan Stasiun MRT
 

Kali ini kita akan membahas mengenai monitoring prometheus dengan visualisasi grafana.

Apa itu prometheus ?

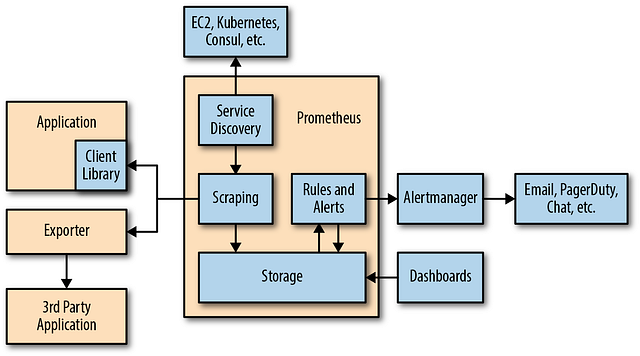
Prometheus adalah open source, sistem monitoring berbasis metrics. Prometheus mudah di gunakan serta memiliki model data yang powerful dan bahasa query yang dapat menganalisa aplikasi dan infrastruktur yang kita miliki.

Dengan format text yang sederhana membuatnya lebih mudah untuk mengekspos metrik ke prometheus.


Apa itu node exporter ?

Eksporter adalah perangkat lunak yang di gunakan tepat di samping aplikasi yang ingin diperoleh metriknya. Eksporter menerima permintaan dari Prometheus, mengumpulkan data yang diperlukan dari aplikasi, mengubahnya menjadi format yang benar, dan kemudian mengembalikannya sebagai respons terhadap Prometheus.

Apa itu Grafana ?

Grafana adalah alat yang populer untuk membuat dashboard untuk berbagai sistem pemantauan dan non monitor, termasuk Graphite, InfluxDB, Elasticsearch, dan PostgreSQL. Ini adalah salah satu tools yang dapat digunakan untuk membuat dashboard saat menggunakan Prometheus.

Sekarang kita akan menginstall node exporter, prometheus dan grafana.

Kebutuhan :

1. Node monitoring: node-monitoring (ip: 10.67.67.30, OS: Centos 7)

2. Node container: node-container (ip: 10.67.67.31, OS: Centos 7)

Lakukan pada node container

Jika menggunakan firewall, buka port 9100 terlebih dahulu

# firewall-cmd --zone=public --permanent --add-port=9100/tcp
# firewall-cmd --reload
# cd /opt
# wget https://github.com/prometheus/node_exporter/releases/download/v0.18.1/node_exporter-0.18.1.linux-amd64.tar.gz
# tar xvfz node_exporter-0.18.1.linux-amd64.tar.gz
# ./node_exporter --help
# ./node_exporter
...
INFO[0000] - netstat source="node_exporter.go:104"
INFO[0000] - nfs source="node_exporter.go:104"
INFO[0000] - nfsd source="node_exporter.go:104"
INFO[0000] - pressure source="node_exporter.go:104"
INFO[0000] - sockstat source="node_exporter.go:104"
INFO[0000] - stat source="node_exporter.go:104"
INFO[0000] - textfile source="node_exporter.go:104"
INFO[0000] - time source="node_exporter.go:104"
INFO[0000] - timex source="node_exporter.go:104"
INFO[0000] - uname source="node_exporter.go:104"
INFO[0000] - vmstat source="node_exporter.go:104"
INFO[0000] - xfs source="node_exporter.go:104"
INFO[0000] - zfs source="node_exporter.go:104"
INFO[0000] Listening on :9100 source="node_exporter.go:170"

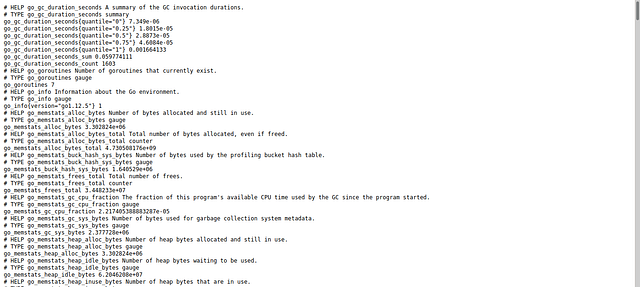
Akses browser http://10.67.67.31:9100/metrics :

metrik

Membuat node exporter sebagai service

# vi /etc/systemd/system/node_exporter.service

[Unit]
Description=Node Exporter

[Service]
User=root
ExecStart=/opt/node_exporter-0.18.1.linux-amd64/node_exporter

[Install]
WantedBy=default.target

Menjalankan servis node exporter

# systemctl daemon-reload
# systemctl enable node_exporter.service
# systemctl start node_exporter.service
# systemctl status node_exporter.service
# journalctl -u node_exporter

Instalasi Prometheus

Lakukan di node-monitoring

jika menggunakan firewall buka port 9090 terlebih dahulu

# firewall-cmd --zone=public --permanent --add-port=9090/tcp
# firewall-cmd --reload
# cd /opt
# wget https://github.com/prometheus/prometheus/releases/download/v2.10.0/prometheus-2.10.0.linux-amd64.tar.gz
# tar xvfz prometheus-2.10.0.linux-amd64.tar.gz
# cd prometheus-2.10.0.linux-amd64
# vi config.yml

global:
scrape_interval: 15s
evaluation_interval: 15s

scrape_configs:
- job_name: 'prometheus'
static_configs:
- targets: ['10.67.67.30:9090']
- job_name: 'node'
static_configs:
- targets: ['10.67.67.31:9100']

Cek konfigurasi prometheus

# ./promtool check config config.yml
# ./prometheus --web.listen-address 10.X0.X0.21:9090 --config.file /opt/prometheus-2.10.0.linux-amd64/config.yml

Membuat prometheus sebagai servis

# vi /etc/systemd/system/prometheus_server.service

[Unit]
Description=Prometheus Server

[Service]
User=root
ExecStart=/opt/prometheus-2.10.0.linux-amd64/prometheus --web.listen-address 10.X0.X0.21:9090 --config.file /opt/prometheus-2.10.0.linux-amd64/config.yml

[Install]
WantedBy=default.target

Jalankan prometheus

# systemctl daemon-reload
# systemctl enable prometheus_server.service
# systemctl start prometheus_server.service
# systemctl status prometheus_server.service
# journalctl -u prometheus_server
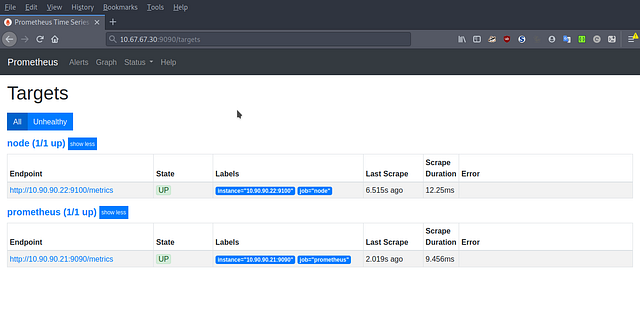
prometheus target

Install Grafana di node-monitoring

Jika menggunakan firewall buka port 3000

# firewall-cmd --zone=public --permanent --add-port=3000/tcp
# firewall-cmd --reload
# cd /opt
# wget https://dl.grafana.com/oss/release/grafana-6.2.5.linux-amd64.tar.gz
# tar -zxvf grafana-6.2.5.linux-amd64.tar.gz
# cd grafana-6.2.5
# ./bin/grafana-server -homepath /opt/grafana-6.2.5 web

Membuat grafana sebagai servis

# vi /etc/systemd/system/grafana.service

[Unit]
Description=Grafana

[Service]
User=root
ExecStart=/opt/grafana-6.2.5/bin/grafana-server -homepath /opt/grafana-6.2.5/ web

[Install]
WantedBy=default.target

Jalankan grafana:

# systemctl daemon-reload
# systemctl enable grafana.service
# systemctl start grafana.service
# systemctl status grafana.service
# journalctl -u grafana

Akses web browser http://10.67.67.30:3000

Credential grafana default:

username : admin
password : admin 
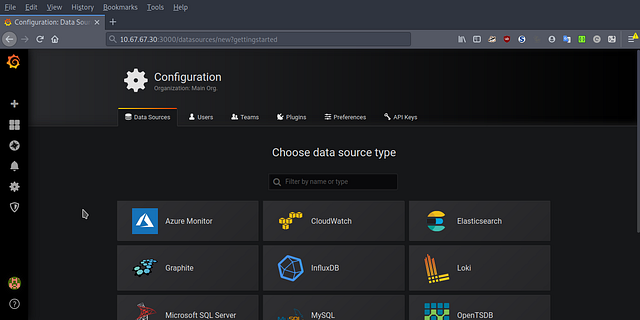
akses dashboard grafana

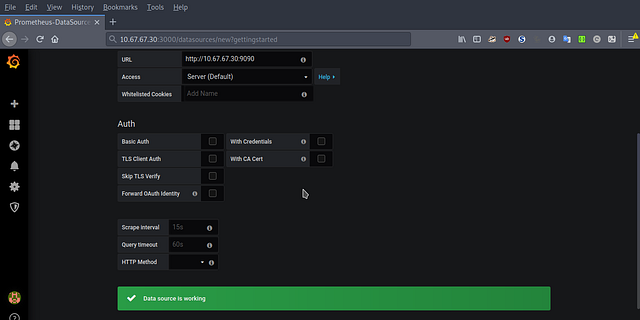
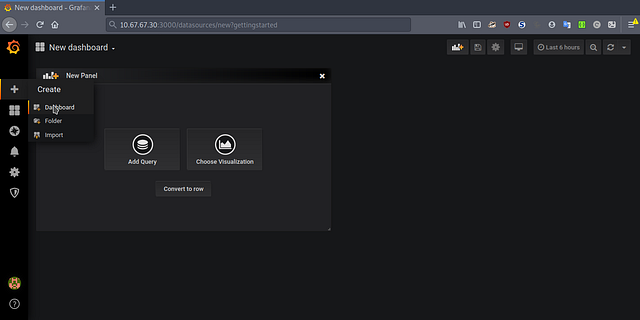
Menambahkan Data Source:

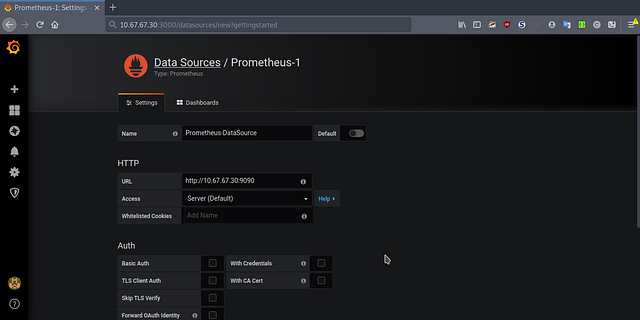
Masuk ke menu Configuration > Data Source > Add data source

Type > Prometheus

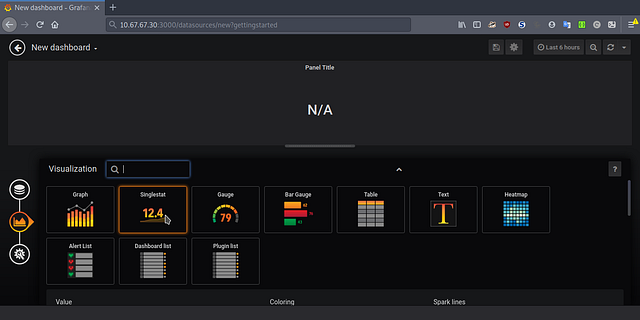
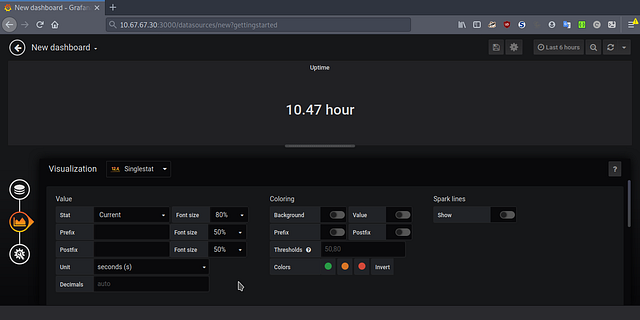
Contoh:

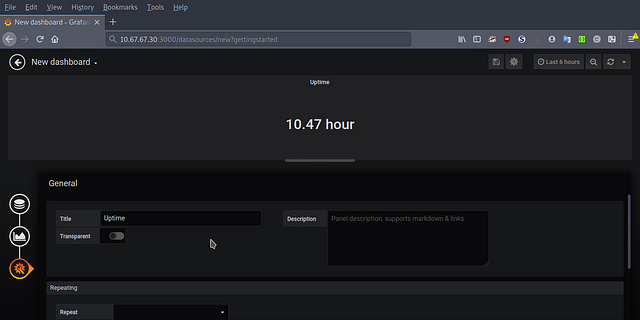
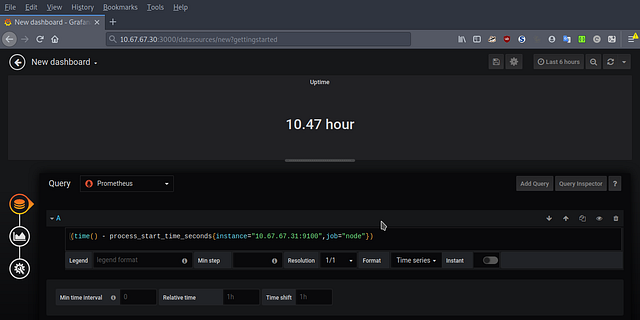
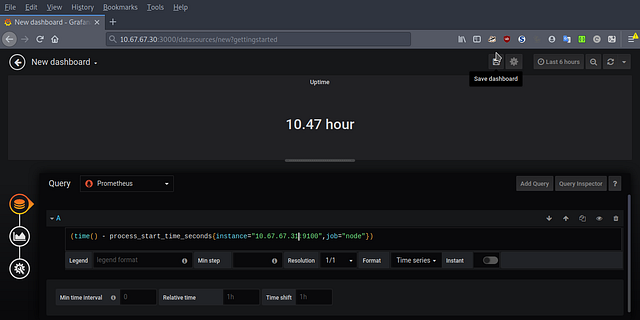
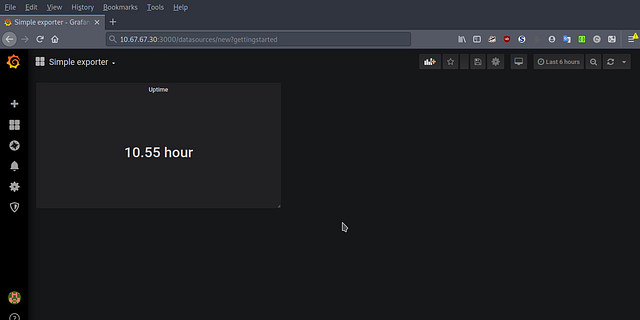
melihat uptime pada node

Sekian dan terimakasih.


Share:

Introduction to Docker Compose

source: docker
Compose is a tool for defining and running multi-container Docker applications. With Compose, you use a YAML file to configure your application’s services. Then, with a single command, you create and start all the services from your configuration. To learn more about all the features of Compose, see the list of features.
Compose works in all environments: production, staging, development, testing, as well as CI workflows. You can learn more about each case in Common Use Cases.

Using Compose is basically a three-step process:

  • Define your app’s environment with a Dockerfile so it can be reproduced anywhere.
  • Define the services that make up your app in docker-compose.yml so they can be run together in an isolated environment.
  • Run docker-compose up and Compose starts and runs your entire app. source : https://docs.docker.com/compose/

Install compose

sudo curl -L https://github.com/docker/compose/releases/download/1.20.1/docker-compose-$(uname -s)-$(uname -m) -o /usr/local/bin/docker-compose

Set permission executable

sudo chmod +x /usr/local/bin/docker-compose

Check docker-compose version

sudo docker-compose — version

Compose and Wordpress

create directory my_wordpress and enter the directory

mkdir /lab/my_wordpress
cd /lab/my_wordpress

create docker-compose.yml file

version: '3.2'
services:
db:
image: mysql:5.7
volumes:
- dbdata:/var/lib/mysql
restart: always
environment:
MYSQL_ROOT_PASSWORD: somewordpress
MYSQL_DATABASE: wordpress
MYSQL_USER: [username]
MYSQL_PASSWORD: [password]
    wordpress:
depends_on:
- db
image: wordpress:latest
ports:
- "8000:80"
restart: always
environment:
WORDPRESS_DB_HOST: db:3306
WORDPRESS_DB_USER: [username]
WORDPRESS_DB_PASSWORD: [password]
volumes:
dbdata:

run compose

sudo docker-compose up -d

View container

sudo docker container ls

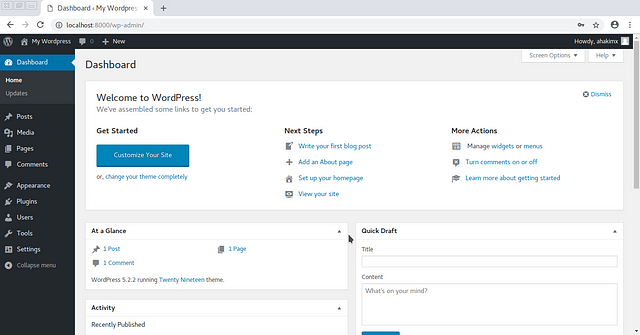
Access Wordpress from browser

Access wordpress on web browser

Thanks

Reference:

https://docs.docker.com/compose/

Share:

Introduction to Jenkins - Install Jenkins


image source: jenkins.io

install docker on centos

$ sudo yum install -y yum-utils \
device-mapper-persistent-data \
lvm2
$ sudo yum-config-manager --add-repo https://download.docker.com/linux/centos/docker-ce.repo

$ sudo yum -y install docker-ce docker-ce-cli containerd.io

$ sudo systemctl start docker
$ sudo systemctl enable docker
$ sudo systemctl status docker

$ usermod -aG docker nanox

Install Docker Compose

$ sudo curl -L "https://github.com/docker/compose/releases/download/1.25.0/docker-compose-$(uname -s)-$(uname -m)" -o /usr/local/bin/docker-compose
$ chmod +x /usr/local/bin/docker-compose
$ docker-compose -v

Downloading the jenkins docker image

$ docker pull jenkins/jenkins
$ docker info | grep -i root
Docker Root Dir: /var/lib/docker
$ du -sh /var/lib/docker
586M /var/lib/docker

create a docker compose file for jenkins

$ mkdir jenkins-data
$ mkdir jenkins_home
$ cd jenkins-data
$ vi docker-compose.yml
version: '3'
services:
jenkins:
container_name: jenkins
image: jenkins/jenkins
ports:
— "8080:8080"
volumes:
— $PWD/jenkins_home:/var/jenkins_home
networks:
— net
networks:
net:

Create a Docker container for jenkins

$ sudo chown 1000:1000 jenkins_home -R
$ docker-compose up -d
$ docker ps
CONTAINER ID IMAGE COMMAND CREATED STATUS PORTS NAMES
cdcd15d0b313 jenkins/jenkins “/sbin/tini — /usr/…” 21 seconds ago Up 19 seconds 0.0.0.0:8080->8080/tcp, 50000/tcp jenkins
$ docker logs -f jenkins
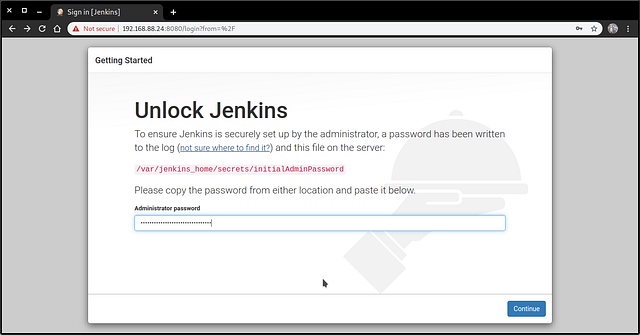
save password -> 
1c94a093462e46cab76f33exxxx

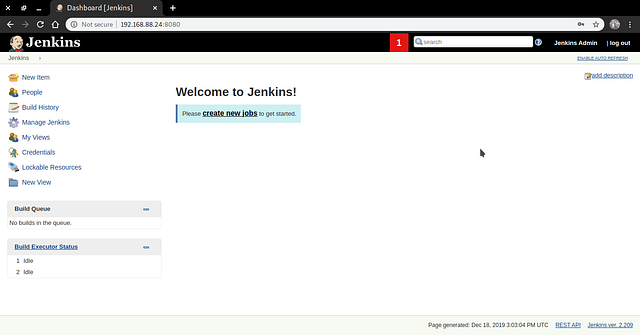
open browser http://192.168.88.24:8080

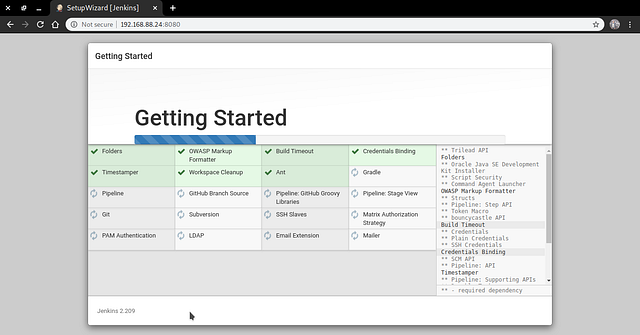
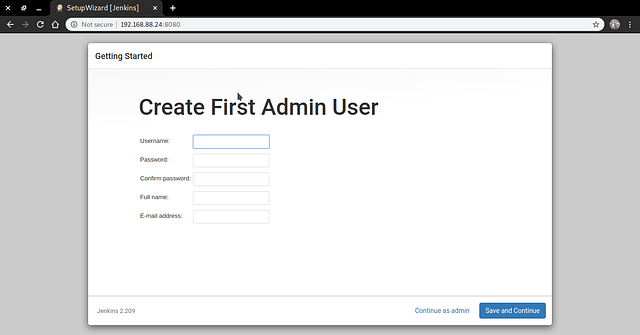
install suggested plugins

Thanks..

Reference: https://docs.docker.com/install/linux/docker-ce/centos/

Share:

Overlay Network without Swarm mode

The overlay network driver creates a distributed network among multiple Docker daemon hosts. This network sits on top of (overlays) the host-specific networks, allowing containers connected to it (including swarm service containers) to communicate securely. Docker transparently handles routing of each packet to and from the correct Docker daemon host and the correct destination container. see detail https://docs.docker.com/network/overlay/

This way of using overlay networks is not recommended for most Docker users. It can be used with standalone swarms and may be useful to system developers building solutions on top of Docker. It may be deprecated in the future. source: https://docs.docker.com/v17.09/engine/userguide/networking/#an-overlay-network-without-swarm-mode


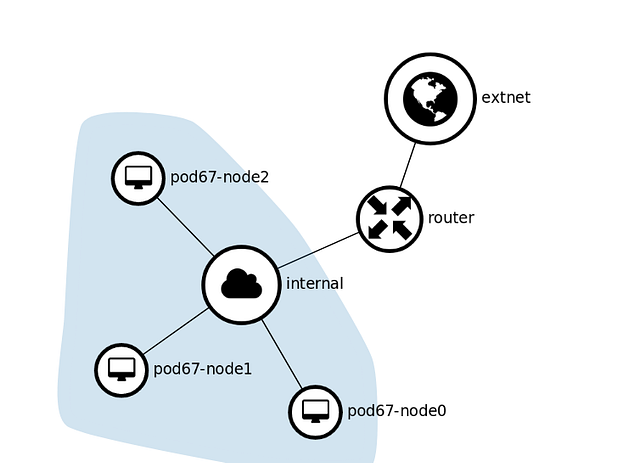
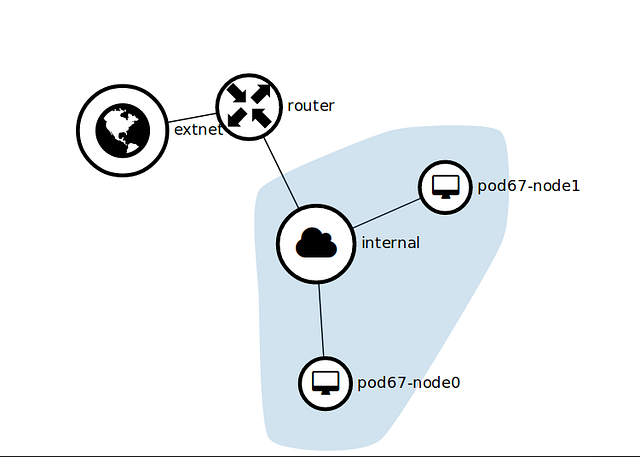
Network Graph


On pod67-node0 run key-value store consul

sudo docker run -d -p 8500:8500 -h consul --name consul progrium/consul -server -bootstrap

On pod67-node1 and pod67-node2 disable docker service and run docker from CLI

sudo systemctl stop docker
sudo systemctl status docker
sudo dockerd -H tcp://0.0.0.0:2375 -H unix:///var/run/docker.sock --cluster-advertise ens3:2375 --cluster-store consul://10.1.67.100:8500 &

On pod67-node1 create overlay network

sudo docker network create -d overlay — subnet=192.168.67.0/24 my-overlay

View networks

sudo docker network ls

on pod67-node1 create container alpine1 connect to my-overlay network

sudo docker run -dit --name alpine1 --network my-overlay alpine ash

On pod67-node2 create container alpine2 connect to my-overlay network

sudo docker run -dit --name alpine2 --network my-overlay alpine ash

On pod67-node2, view my-overlay network details

sudo docker network inspect my-overlay

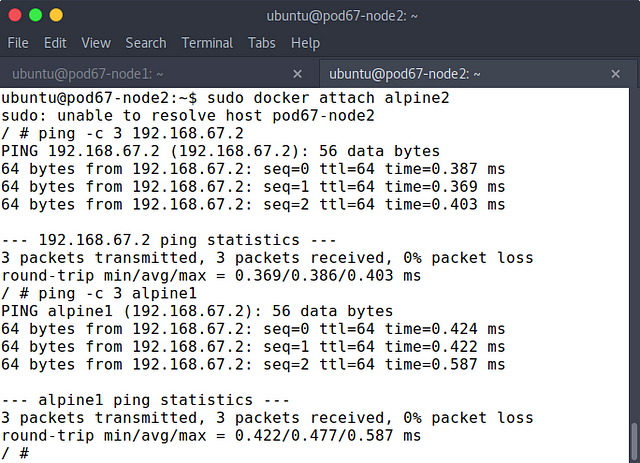
On pod67-node2 enter the alpine2 container and ping to the IP address alpine1 container

sudo docker attach alpine2
ping -c 3 192.168.67.2
ping -c 3 alpine1
test ping to alpine1

reference :

https://docs.docker.com/v17.09/engine/userguide/networking/#an-overlay-network-without-swarm-mode

https://docs.docker.com/network/bridge/

Share:

User Defined Bridge on Docker Network


source image : deploybot.com

Differences between user-defined bridges and the default bridge

User-defined bridges provide better isolation and interoperability between containerized applications.

Containers connected to the same user-defined bridge network automatically expose all ports to each other, and no ports to the outside world. This allows containerized applications to communicate with each other easily, without accidentally opening access to the outside world.

User-defined bridges provide automatic DNS resolution between containers.

Containers on the default bridge network can only access each other by IP addresses, unless you use the --link option, which is considered legacy. On a user-defined bridge network, containers can resolve each other by name or alias.

Containers can be attached and detached from user-defined networks on the fly.

During a container’s lifetime, you can connect or disconnect it from user-defined networks on the fly. To remove a container from the default bridge network, you need to stop the container and recreate it with different network options.

Each user-defined network creates a configurable bridge.

User-defined bridge networks are created and configured using docker network create. If different groups of applications have different network requirements, you can configure each user-defined bridge separately, as you create it.

Linked containers on the default bridge network share environment variables.

Containers connected to the same user-defined bridge network effectively expose all ports to each other. For a port to be accessible to containers or non-Docker hosts on different networks, that port must be published using the -p or --publish flag. source: https://docs.docker.com/network/bridge/

Create bridge network

sudo docker network create --driver bridge alpine-net

View the network list

sudo docker network ls

View the alpine-net network details

sudo docker network inspect alpine-net

Create 3 container with: 

1. alpine1 container connect to default bridge network

2. alpine2 container connect to alpine-net network

3. alpine3 container connect to network default bridge and alpine-net

sudo docker run -dit --name alpine1 alpine ash
sudo docker run -dit --name alpine2 --network alpine-net alpine ash
sudo docker run -dit --name alpine3 alpine ash
sudo docker network connect alpine-net alpine3

View network bridge details

sudo docker network inspect bridge

view network alpine-net details

sudo docker network inspect apline-net

Enter the alpine3 container and ping alpine1 ip, alpine1 and alpine2 name

sudo docker attach alpine3

ping IP alpine1

ping -c 3 172.17.0.2

ping name alpine1

ping -c 3 alpine1

ping alpine2 name

ping -c 3 alpine2

Enter the alpine2 and ping to alpine1 IP and ping to the internet

# ping -c 3 172.17.0.2

failed, because different bridge network and subnet

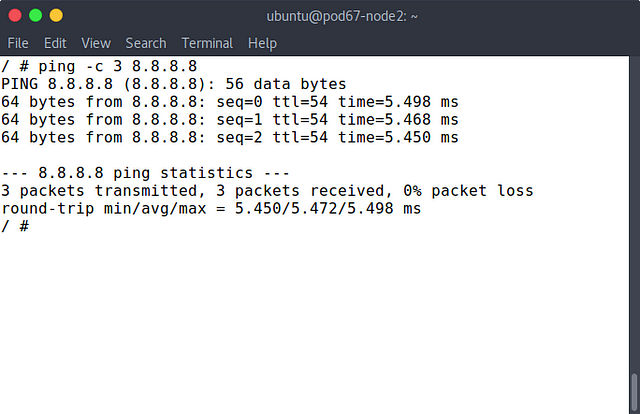
ping internet succeed

ping internet will be succeed.

# ping -c 3 8.8.8.8

ping internet will be succees.

reference : https://docs.docker.com/network/bridge/

Share:

Default Bridge Network on Docker Networking


source image : deploybot.com
In terms of networking, a bridge network is a Link Layer device which forwards traffic between network segments. A bridge can be a hardware device or a software device running within a host machine’s kernel.
In terms of Docker, a bridge network uses a software bridge which allows containers connected to the same bridge network to communicate, while providing isolation from containers which are not connected to that bridge network. The Docker bridge driver automatically installs rules in the host machine so that containers on different bridge networks cannot communicate directly with each other.
Bridge networks apply to containers running on the same Docker daemon host. For communication among containers running on different Docker daemon hosts, you can either manage routing at the OS level, or you can use an overlay network.
When you start Docker, a default bridge network (also called bridge) is created automatically, and newly-started containers connect to it unless otherwise specified. You can also create user-defined custom bridge networks. User-defined bridge networks are superior to the default bridge network. source: https://docs.docker.com/network/bridge/

 view docker network

sudo docker network ls

run apline container

sudo docker run -dit — name alpine1 alpine ash
sudo docker run -dit — name alpine2 alpine ash

view container list

sudo docker container ls

view network bridge details

sudo docker network inspect bridge

Enter to the alpine1 container

sudo docker network inspect bridge

see ip address

# ip add

Test ping to the internet

# ping -c 3 8.8.8.8

Test to alpine2 container

# ping -c 3 172.17.0.3

Exit the alpine1 container without close the shell

press the ctrl+p, ctrl+q button

Remove the two containers

sudo docker container rm -f alpine1 alpine2

reference : https://docs.docker.com/network/bridge/

Share:

Use Volume Driver on Docker


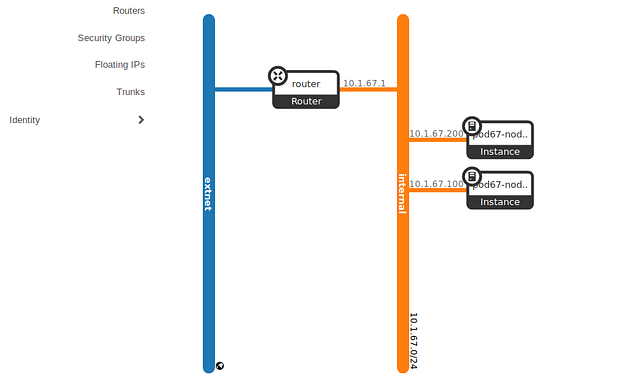
network graph on openstack


Network topology on Openstack

I use two instance for volume driver

SSH to pod67-node1 floating IP from pod67-node0

ssh -l ubuntu 10.1.1.13

create /share directory

sudo mkdir /share

change directory permission

sudo chmod 777 /share

exit from pod67-node1

exit

Install plugin sshfs

sudo docker plugin install --grant-all-permissions vieux/sshfs

View plugins

sudo docker plugin ls

Disable plugin

sudo docker plugin disable [PLUDIN ID]

Set plugin

sudo docker plugin set vieux/sshfs sshkey.source=/root/.ssh/

Enable plugin

sudo docker plugin enable 86d094668892

View plugins

sudo docker plugin ls

Create volume with driver sshfs

sudo docker volume create — driver vieux/sshfs -o sshcmd=root@10.1.1.13:/share -o allow_other sshvolume

run container with volume

sudo docker run -d — name=nginxtest-ssh -p 8090:80 -v sshvolume:/usr/share/nginx/html nginx:latest

SSH to pod67-node1

ssh -l 10.1.1.13

Add text to file index.html

sudo sh -c "echo 'Hello, I am hakim' > /share/index.html"

See index contents

sudo cat /share/index.html

exit from pod67-node1

exit

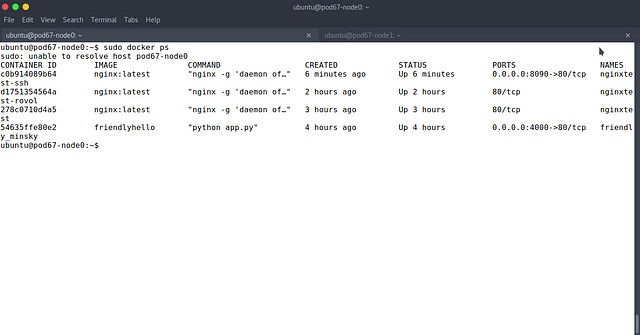
Docker ps

sudo docker ps

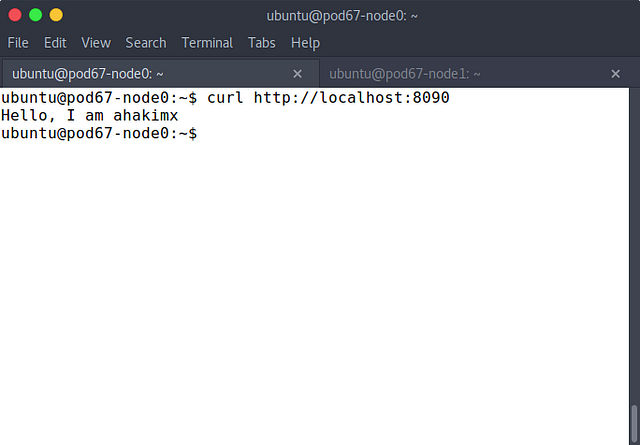
test the container


let’s back to part 1, introduction to docker volumes.

Share:

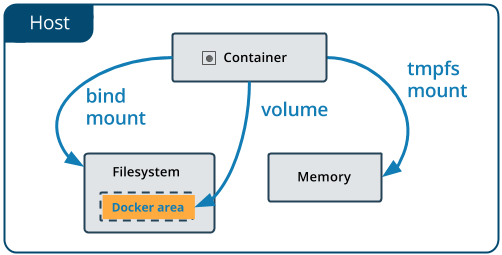
Introduction to Docker Volumes


source image:

Volumes are the preferred mechanism for persisting data generated by and used by Docker containers. While bind mounts are dependent on the directory structure of the host machine, volumes are completely managed by Docker. Volumes have several advantages over bind mounts:

  • Volumes are easier to back up or migrate than bind mounts.
  • You can manage volumes using Docker CLI commands or the Docker API.
  • Volumes work on both Linux and Windows containers.
  • Volumes can be more safely shared among multiple containers.
  • Volume drivers let you store volumes on remote hosts or cloud providers, to encrypt the contents of volumes, or to add other functionality.
  • New volumes can have their content pre-populated by a container.

In addition, volumes are often a better choice than persisting data in a container’s writable layer, because a volume does not increase the size of the containers using it, and the volume’s contents exist outside the lifecycle of a given container. source: https://docs.docker.com/storage/volumes/

docker volume

Create docker volume:

sudo docker volume create test-volume

see volumes

sudo docker volume ls

see volume detail

sudo docker volume inspect test-volume

run container with volume

sudo docker run -d — name=nginxtest -v test-volume:/usr/share/nginx/html nginx:latest

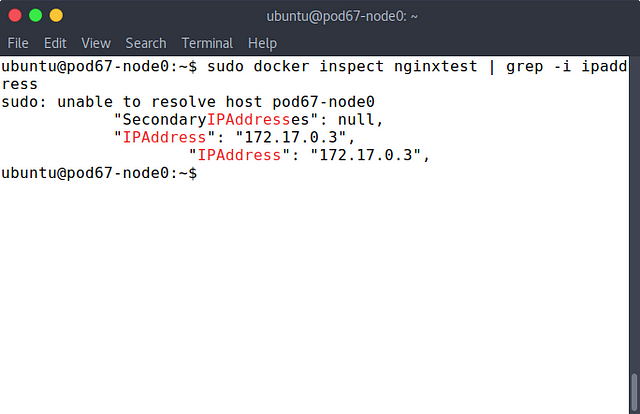
see IP address container

sudo docker inspect nginxtest | grep -i ipaddress
docker inspect nginxtest

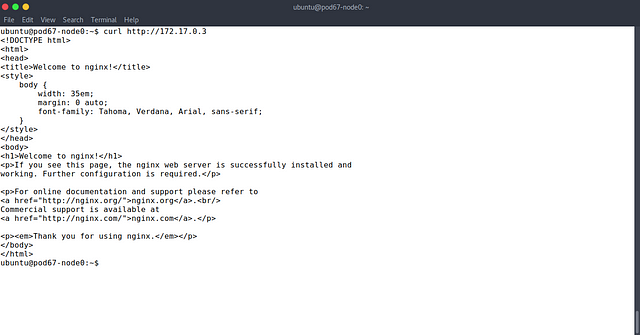
Test browsing app

curl http:172.17.0.3

test app container IP

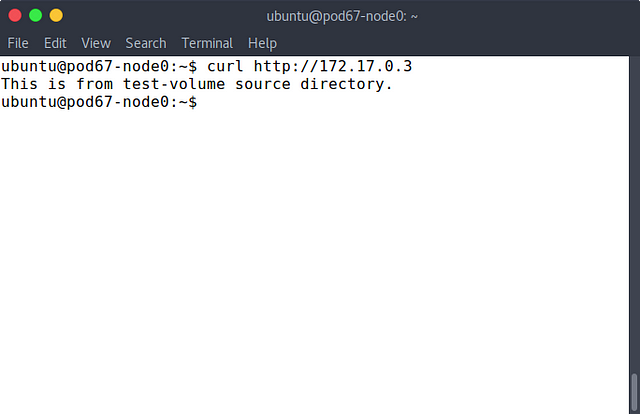
Create file index.html and move to source volume directory

sudo echo "This is from test-volume source directory." > index.html

sudo mv index.html /var/lib/docker/volumes/test-volume/_data

Then test again

access the container IP

Run container with read only volume

sudo docker run -d — name=nginxtest-rovol -v test-volume:/usr/share/nginx/html:ro nginx:latest

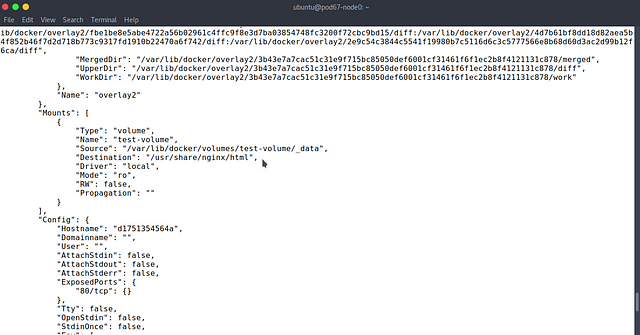
view nginx container detail

nginxtest-rovol container detail

Let’s move on to part 2 volume driver is here.

reference : https://docs.docker.com/storage/volumes/

Share:

Introduction to Dockerfile Part II

source image : deploybot.com

Create Dockerfile

vim Dockerfile 

Dockerfile content:

# Use an official Python runtime as a parent image
FROM python:2.7-slim# Set the working directory to /app
WORKDIR /app# Copy the current directory contents into the container at /app
ADD . /app# Install any needed packages specified in requirements.txt
RUN pip install — trusted-host pypi.python.org -r requirements.txt# Make port 80 available to the world outside this container
EXPOSE 80# Define environment variable
ENV NAME World# Run app.py when the container launches
CMD ["python", "app.py"] 

Create requirements.txt file

Flask
Redis

Create app.py file

from flask import Flask
from redis import Redis, RedisError
import os
import socket

# Connect to Redis
redis = Redis(host="redis", db=0, socket_connect_timeout=2, socket_timeout=2)

app = Flask(__name__)

@app.route("/")
def hello():
try:
visits = redis.incr("counter")
except RedisError:
visits = "<i>cannot connect to Redis, counter disabled</i>"

html = "<h3>Hello {name}!</h3>" \
"<b>Hostname:</b> {hostname}<br/>" \
"<b>Visits:</b> {visits}"
return html.format(name=os.getenv("NAME", "world"), hostname=socket.gethostname(), visits=visits)

if __name__ == "__main__":
app.run(host=’0.0.0.0', port=80)

Build image from Dockerfile

sudo docker build -t friendlyhello .

See image friendlyhello

sudo docker image ls

Run image friendlyhello

sudo docker run -d -p 4000:80 friendlyhello

See container :

sudo docker container ls

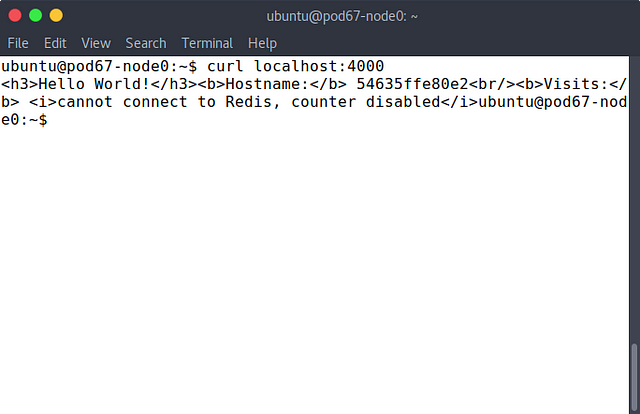
Test app using curl

curl http://localhost:4000

curl localhost

Share: